Infomart Data Center Portland
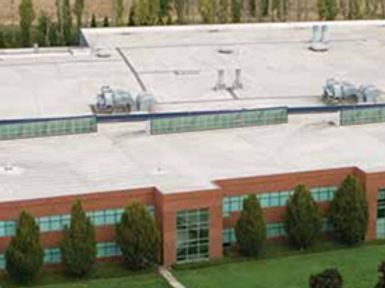
When Infomart's Portland data center opened in 2016 it was the company's most energy efficient, with a fully integrated backbone and the entire building management system on a single interface. Although each new Infomart data center is more efficient than the last, Portland remains a high standard for operational and energy efficiency. One building consumes 240,000 sq. ft. within which OTI has implemented a hybrid Niagara and SkySpark analytics engine for data collection and analysis.
Challenges
Data centers require very controlled environments, and each client’s data processing needs require unique sets of data collection and monitoring rules. The goal of this project was to utilize the SkySpark platform and integrate it with Niagara for a flexible, fast and highly visual output of analytic information for both the data center and the client.
Initial challenges included:
- Extremely controlled data center environment.
- 352 pieces of equipment with 128,000 single project points to monitor in real time.
- Seamless Niagara and SkySpark integration.
Successes
For one of the data center's specific customers, OTI established the analytics and alerting system which required integrating with the data center's overall system while also as suiting the needs of the individual client.
Other successes include:
- Customized alert time for further client knowledge and control of sensitive environment.
- Project manager knows exactly where to look when alerts are detected.
- Historic charts to measure averages per year and calculate actual cost savings against key performance indicators.